Yelp-data-challenge
sentiment analysis in yelp data
View the Project on GitHub hrushikesh-dhumal/Yelp-Data-Challenge
Introduction
With the explosion of social media, more and more people are blogging and writing reviews about different places they visit. Yelp is one the popular platform where people post their ratings and write reviews. User-generated reviews are usually inconsistent in terms of length, content, writing style and usefulness because they are written by unprofessional writers. Also, they contain a mix of positive and negative emotions. Important information can be easily obscured unless users are willing to spend a great deal of time and effort on reading the reviews thoroughly. A common natural language processing technique is to generate bag of words and use that for analysis. But, it does not account for the positive or negative sentiment of the user. So I am using the word embedding approach to understand how neural networks can help us better identify the sentiments in the reviews. I am considering the five star ratings by user as the parameter to measure the degree of positivity or negativity in the review. One being the most negative and five being the most positive review. Through this work, I hope to encourage more researchers to study and analyze the Yelp data set.
The project is broken into 3 parts:
Data Cleaning
- Converted data from json file to flat format- csv.
- Identified and removed features with null values.
- Inner-joined key-ids from Users, Businesses and Review tables to create the master data set with 22,25,213 records.
- Created a random subset of 2,225 records. I have provided this subset in the repository.
Exploratory Data Analysis
In EDA, I am trying to find pertinent features for the next step which is the predictive analytics/machine learning task.
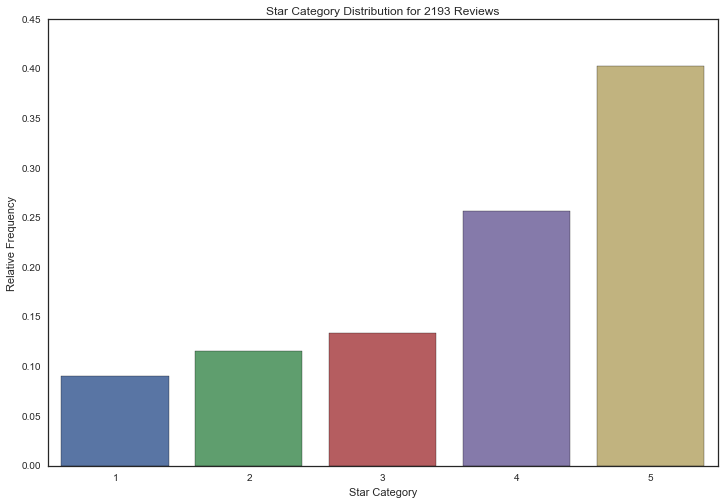
When I visualized distribution of star rating, I was surprised to see it was skewed to the 4 and 5 star categories heavily. They consist of around 80% of the distribution, whereas the 1, 2, and 3 star categories are each only around 10-15% at most. This is confirmed by a separate analysis by Max Woolf on 1 and 5 star reviews which showed, that Yelp reviews have started to appear more optimistically biased as time passes. The data subset reflects this skewed distribution, and uneven class distribution will become noteworthy further on in our predictive analytics task.
I used this information to set our baseline accuracy for algorithm evaluation to 40% which is the percentage of 5 star ratings in the data.
Next I was curious about what kinds of words, are characteristic of different star categories so I did some word cloud visualizations.
Word cloud for one star reviews
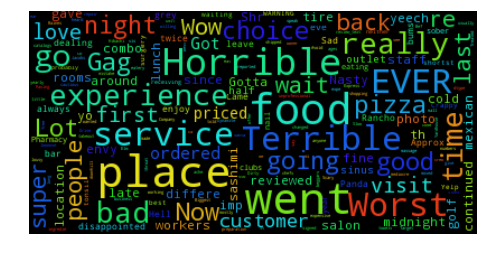 The 1-star Yelp reviews use very little positive language, for eg: “Horrible” and “Worst”. 1-Star reviews frequently contain warnings for potential customers, which promises that the author will “never go back”. Sometime I see sarcasm in form of words like “wow” and “love” used in 1 star rating.
 Word cloud for two star reviews
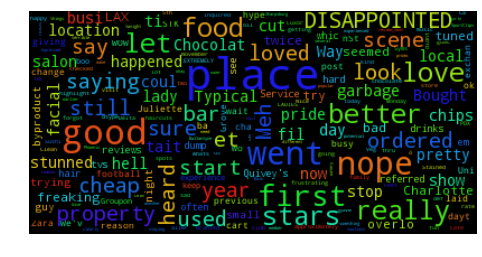
Word cloud for three star reviews
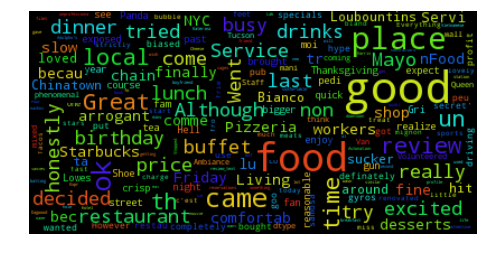
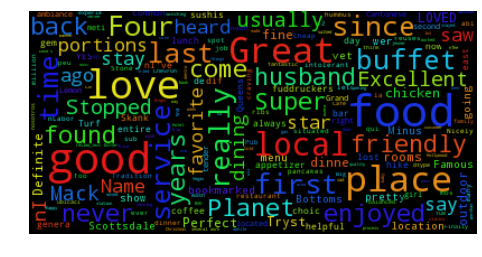
Word cloud for four star reviews
Word cloud for five star reviews
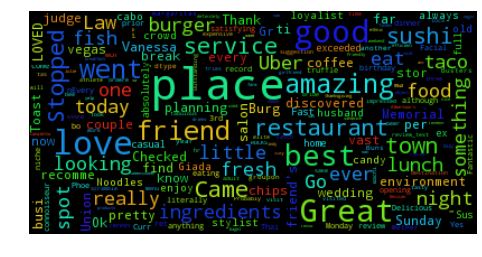 The 5-star Yelp reviews contain many instances of “Great”, “Good”, and “best”. But reviewers are also using positive words sarcastically to indicate negative sentiments. This inspired me to use neural networks in form of word embedding's and Long Short term Memory neural networks.
Further, to see if Yelp reviews follow the Zipfs Law I created the following visualization to see how the most frequently occurring words are ranked.
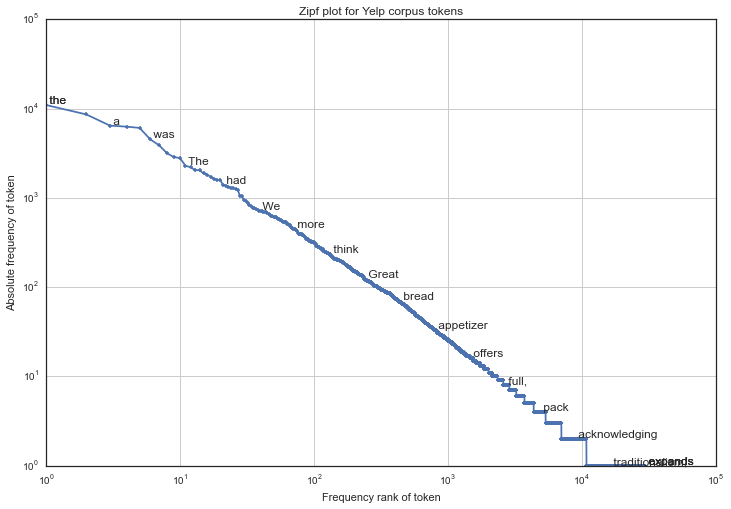
The plot basically shows the log of rank i.e. descending order of how frequently is a word occurring in the yelp corpus Vs log of the frequency of word. I can see that it is almost a straight line indicating that even Yelp corpus focus the Zipfs law! To further enhance the understanding I have created an interactive visualization where you can see the frequency of word vs rank plot here.
I see that words such as the, it which are repeated more prominently and need to be removed.
Predictive analytics/machine learning
Will be adding to this section soon.